The Reporting section in Billingnow allows you to generate detailed, filterable reports across all your business data invoices, estimates, credit notes, expenses, payments, and taxes in a single unified reporting engine.
It is designed to help you analyze performance, monitor financial status, and export accurate data for accounting, audits, or decision-making.
From this module, you can:
- View all financial activity in one place
- Filter data dynamically by type, period, status, and relation
- Analyze sales, payments, expenses, and taxes
- Export reports for accounting or compliance
- Track trends over time with accurate totals
📍 Accessing Reporting
Navigate to Sidebar → Reporting
The Reporting page opens with a dynamic filter bar at the top and a results table below.
⚙️ How Reporting Works
The Reporting page is fully dynamic.
When you change the Report Type, the system automatically updates:
- Available filters
- Table columns
- Displayed metrics
- Totals and aggregations
Each report type is optimized for its specific use case (Sales, Payments, Tax, etc.).
There is no static table layout: the structure adapts to what you are analyzing.
🔍 Available Filters
At the top of the page, you can combine multiple filters freely.
| Filter | Description |
|---|---|
| Report Type | Defines what kind of data you want to analyze |
| Period | Time range (Today, This Month, Last Month, This Year, Custom) |
| Years | Year selection (for yearly or tax reports) |
| Relation | Filter by a specific client or supplier (optional) |
| Status | Filters based on the selected report type (invoice, payment, expense statuses) |
You can combine multiple filters at the same time to build very precise reports.
📊 Available Report Types
Each report type focuses on a specific business perspective.
| Report Type | Purpose | Typical Metrics Shown |
|---|---|---|
| Activity | Global business activity timeline | Status, dates, totals |
| Sales | Revenue from invoices | Invoice totals, paid amounts |
| Sales Per Date | Sales trends over time | Daily or monthly totals |
| Sales Per Client | Revenue grouped by client | Client totals |
| Sales Per Items | Revenue per product or service | Item quantities and totals |
| Payments | All incoming and outgoing payments | Amount, method, date |
| Payments Per Date | Cash flow over time | Daily or monthly payment totals |
| Payments Per Relation | Payments grouped by client or supplier | Paid amounts per relation |
| Payments Per Type | Breakdown by payment method | Bank transfer, cash, card, etc. |
| Expenses | Company expenses | Expense totals |
| Expenses Per Date | Expense trends | Monthly expenses |
| Expenses Per Relation | Expenses grouped by supplier | Supplier totals |
| Tax | Tax balance (sales vs deductible expenses) | Collected, deductible, balance |
| Tax Per Designation | Tax grouped by VAT or tax rate | Amount per tax rate |
Each report type activates only the filters and columns that are relevant to that report.
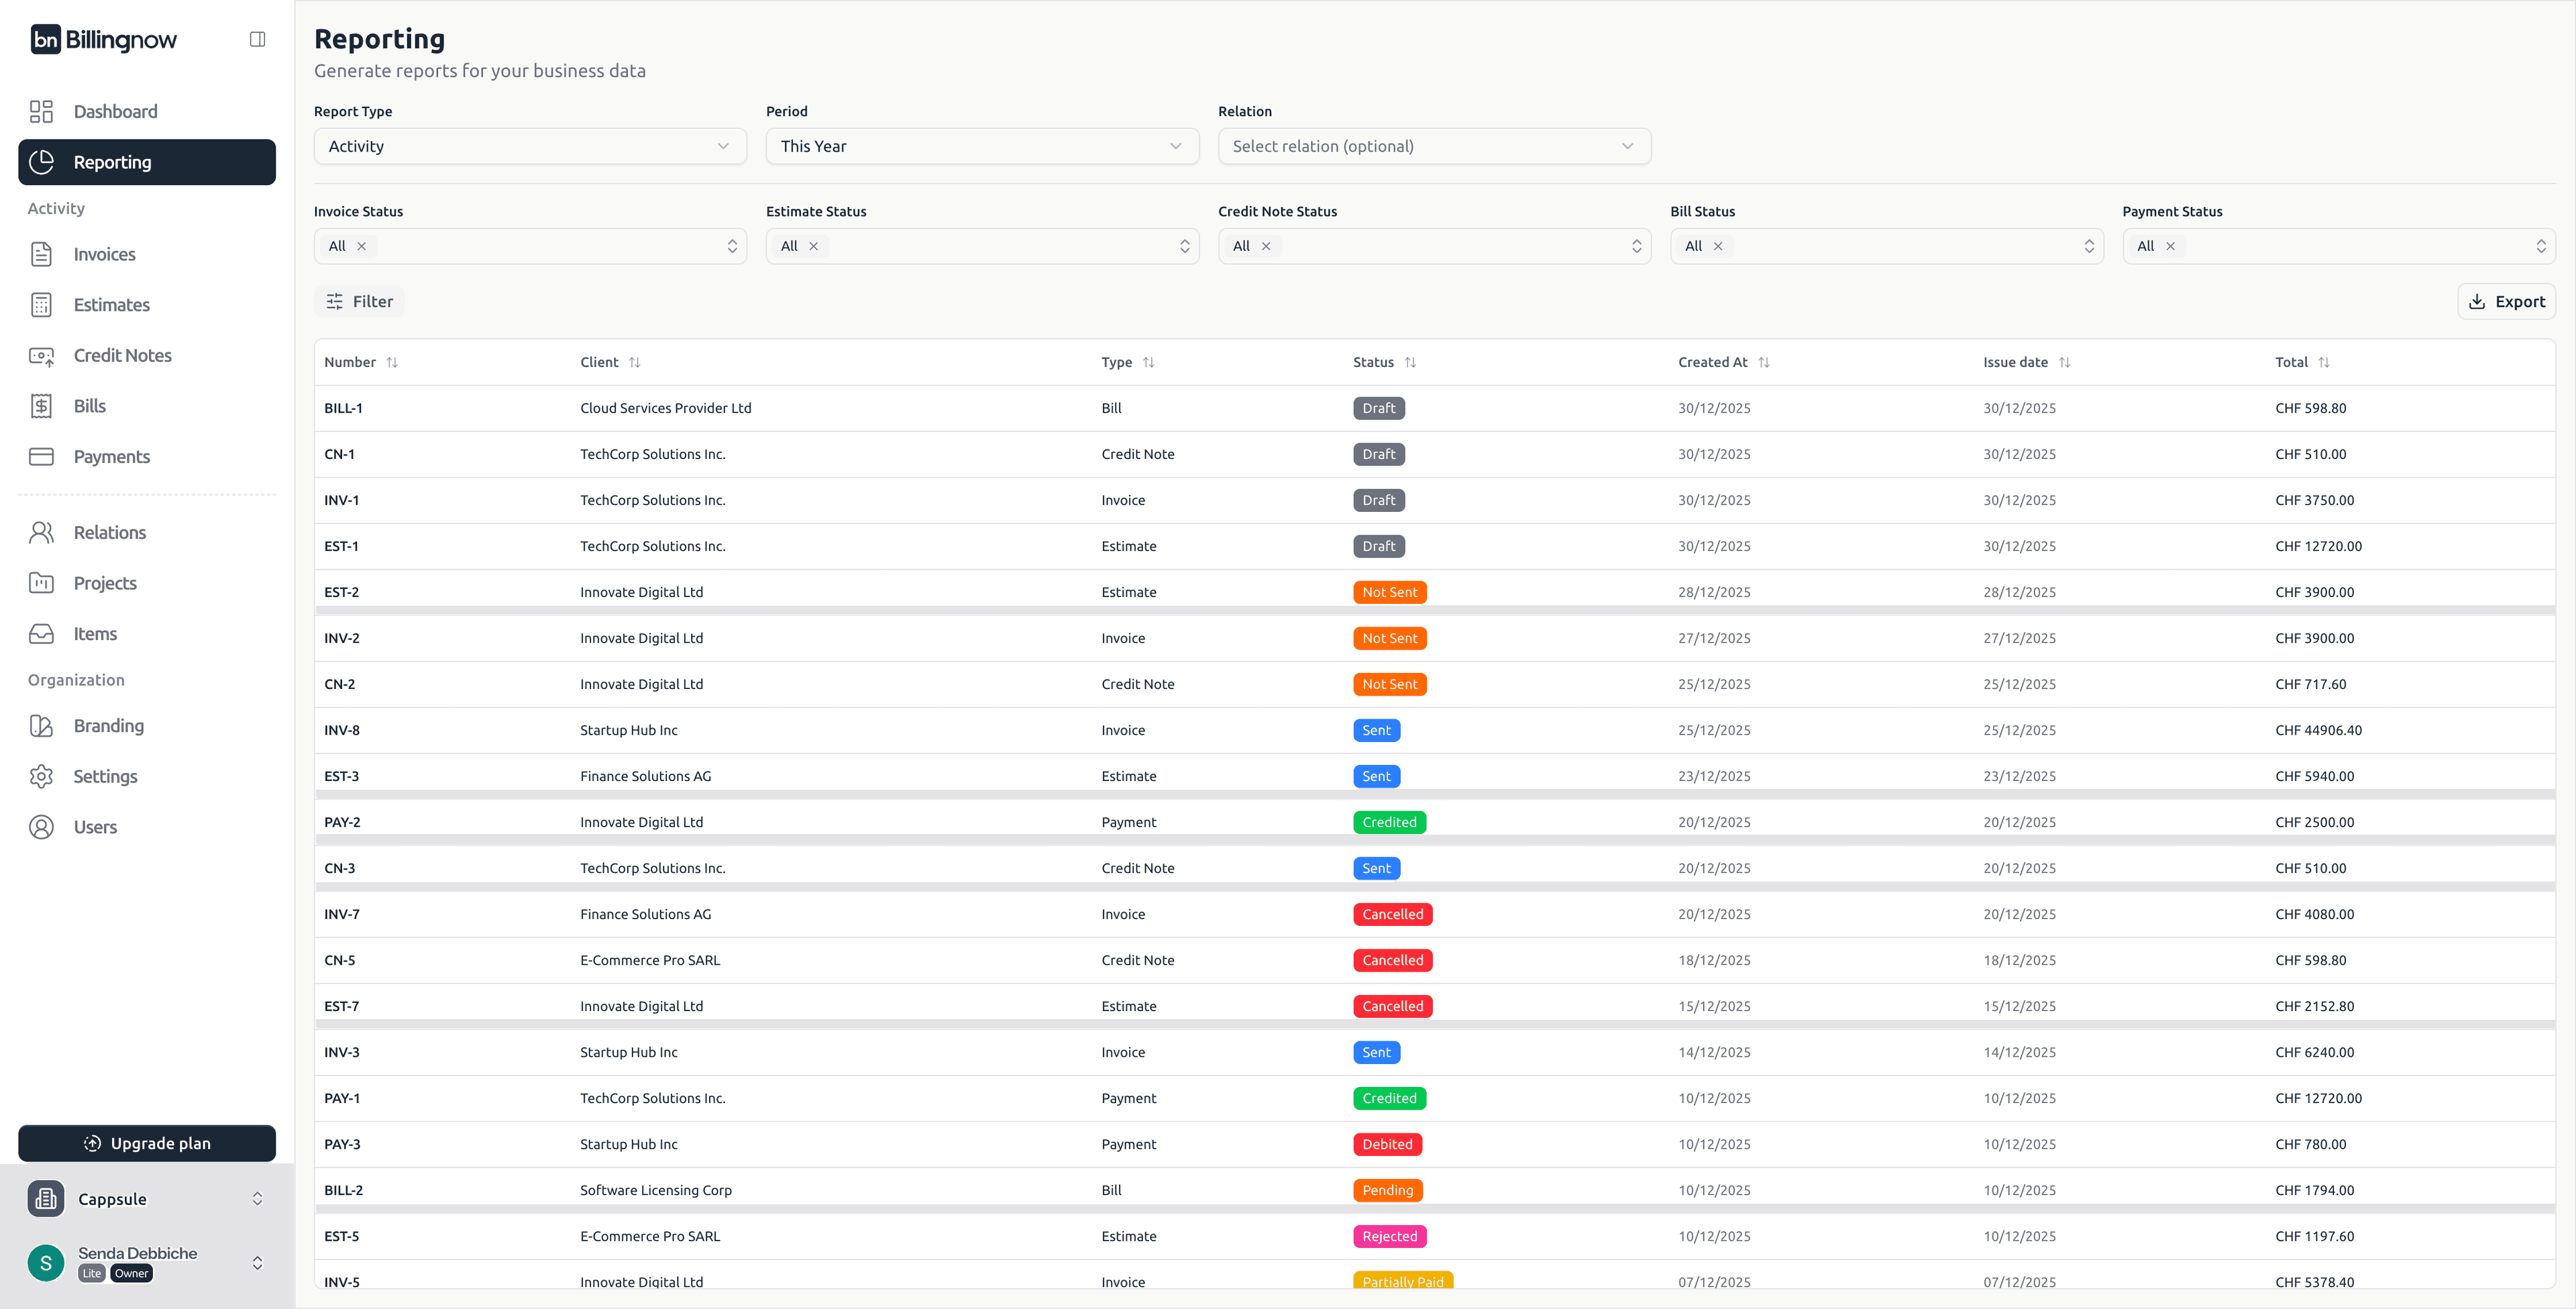
📋 Results Table
The results table updates instantly when filters change.
Example: Activity Report
When Report Type → Activity is selected, the table typically shows:
| Column | Description |
|---|---|
| Number | Document reference (Invoice, Expense, Payment, etc.) |
| Client | Client or supplier |
| Type | Document type |
| Status | Lifecycle status with color badge |
| Created At | Creation date |
| Issue Date | Issue date |
| Total | Total amount |
🏷️ Status Color Indicators
Statuses are displayed with consistent color coding across all reports.
| Status | Color |
|---|---|
| Draft | ⚪ Grey |
| Not Sent | 🟠 Orange |
| Sent | 🔵 Blue |
| Credited | 🟢 Green |
| Debited | 🔴 Red |
| Cancelled | 🔴 Red |
| Pending | 🟠 Orange |
| Partially Paid | 🟡 Amber |
| Paid | 🟢 Green |
| Overdue | 🟣 Pink |
| Rejected | 🟣 Pink |
| Expired | 🟣 Pink |
| Approved | 🟢 Green |
📤 Exporting Reports
Once your filters are applied, click Export (top-right corner).
Supported formats:
- CSV
- Excel (.xlsx)
The exported file always reflects exactly what you see on screen, including:
- Selected report type
- Active filters
- Period and year
- Current sorting
📊 Example: Tax Report
When Report Type → Tax is selected:
- Columns switch to Sales Tax, Expenses Tax, and Balance
- Period grouping changes (e.g. monthly)
- Tax-specific filters become available
This allows you to quickly understand:
- VAT collected on sales
- VAT deductible on expenses
- Net tax balance for each period
💡 Best Practices
✔ Use Activity + This Year for annual overviews
✔ Use Sales Per Client before client reviews
✔ Use Payments Per Date to monitor cash flow
✔ Use Tax reports for VAT declarations
✔ Export reports monthly for accounting consistency
✅ Why Reporting Is Powerful
The Reporting module gives you:
- A single source of truth for all financial data
- Dynamic, context-aware reporting
- Accurate exports aligned with on-screen data
- Clear audit trails across time periods
Reporting in Billingnow ensures clarity, traceability, and control over your business data without manual spreadsheets or duplicated work.